
I lost my entire savings back in the 1980s when silver dropped from a very low price to an absurdly low price. I had bought paper silver. It became worthless. I was lucky that was as bad as it got, and it taught me a great lesson.
If it ain’t in your possession, it ain’t your possession.
Fast-forward several decades and here I sit, staring at the wonder that is my Lines Of Force theory of modeling over time. Even though I am the guy who discovered this mess, it consistently surprises me.
Look at this model of Silver/USD:
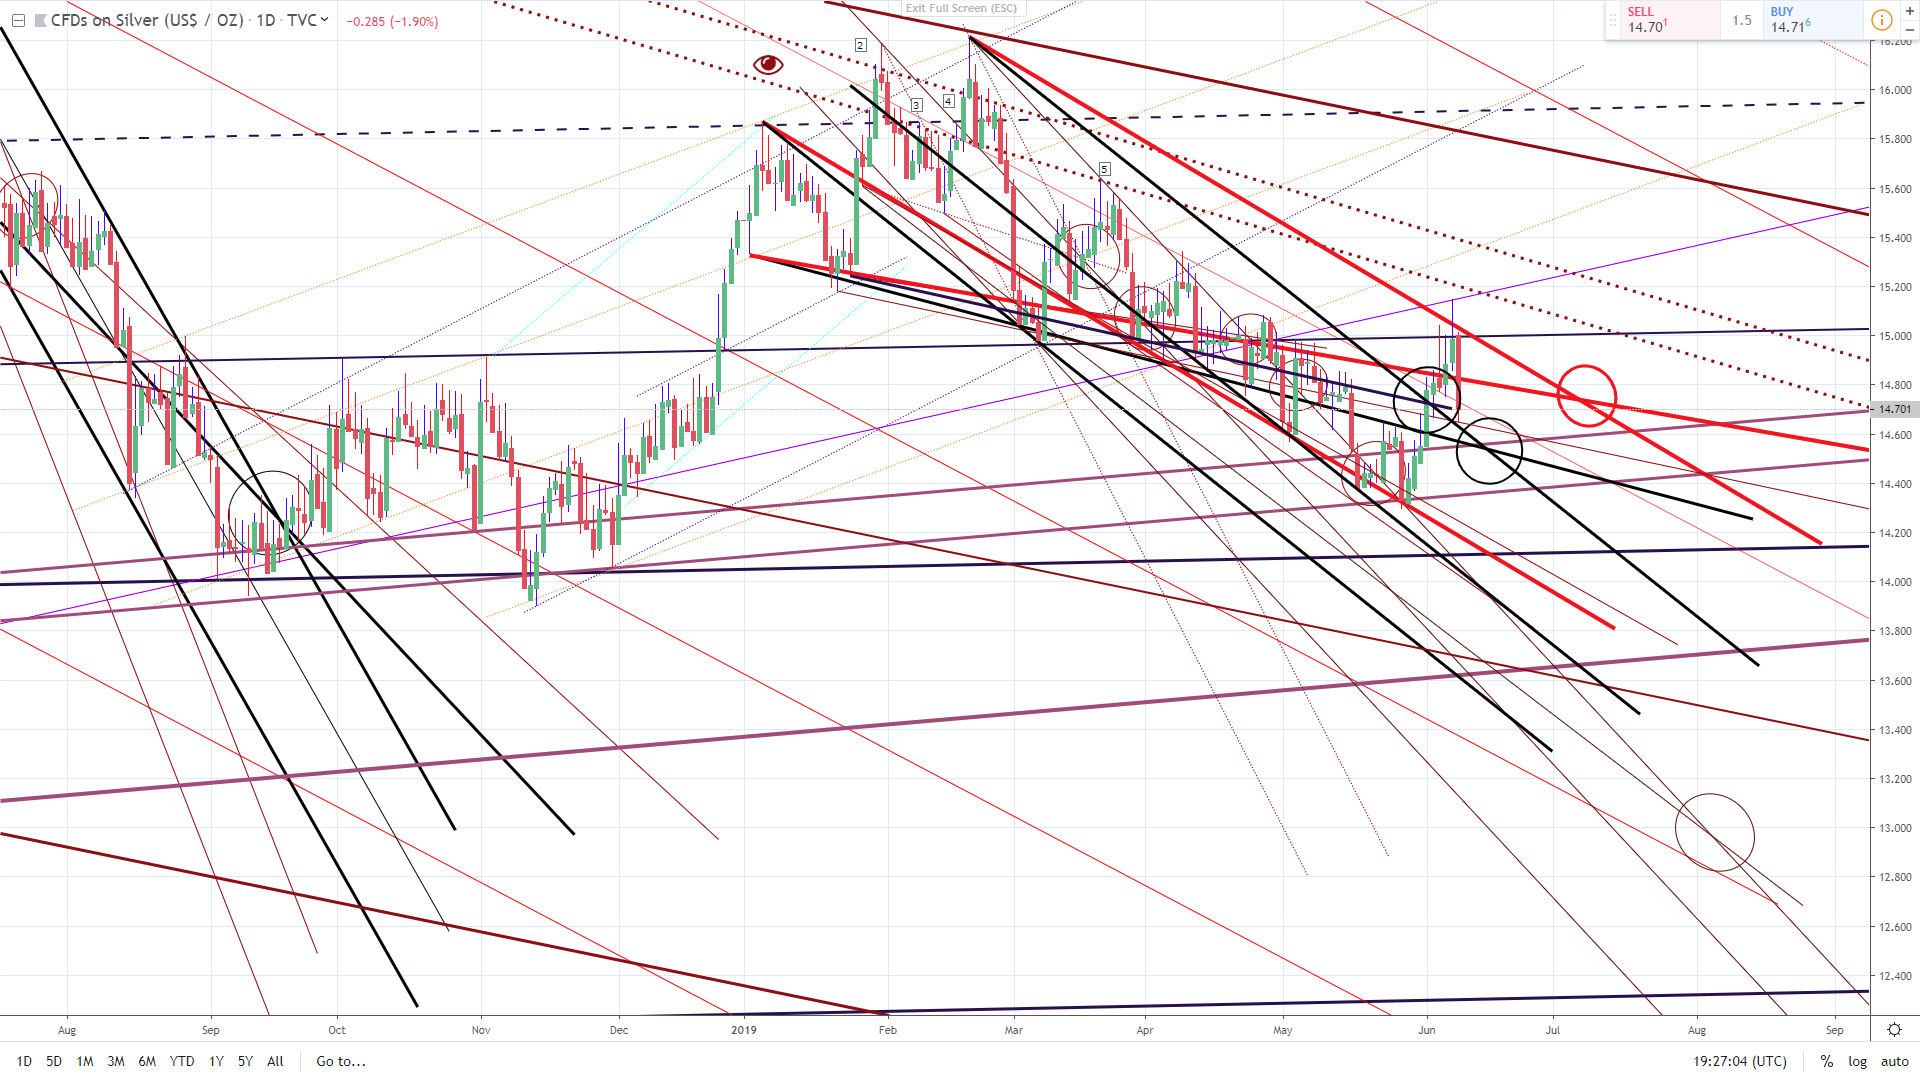
See all those circles? Every one of them predicted where price would be, sometimes months in advance.
I know, I know. This has to be fluke or else I am drawing a bunch of lines after the fact and trying to fool you. Right?
I’ve been fine-tuning this method of modeling since 2014. In more than 99% of the hundreds of models I’ve drawn, this works exactly as shown here. The trick is to ignore the price and focus on the forces moving the price. I’m slowly working on an updated version of my ebook, but until then the original is HERE if you’d like to investigate deeper. I specifically recommend the information on Fall Channels found both in the book and in other articles on the website.
And that is all good… I’d be amenable to showing any and all of you how to do this yourselves. But that’s not why I am coming out of my hidey-hole to post this. There is something in the model that perplexes me.
In the lower right corner an EXIT has appeared below the $13 level in early August. Everything in me says that this must be a fluke, one of the 1% of model Fall Channels that are in error.
Yet it is there. It worries me. Enough that I postponed a large purchase of silver in late May and bought instead only 11 ounces.
I’d love to hear some opinions on this. Do you think silver/USD can drop to that level?